BOY OPI中に張り付けた DataBrowser のスケールを変更したい
概要
XYGraphのスケール変更はpropertyを変えるだけなので容易に実現できる。 しかし、DataBrowserは別のpltファイルを読んでいるだけで、横軸・縦軸の変更はデフォルトでは不可能。 いままでは個別のpltファイルを別のDataBrowserプロットとして新しいViewとして表示し、レイアウトをマウスで変更することで複数のグラフを表示してきた。 しかし、これでは決まったグラフをいつもと同じ場所に表示したいときに不便。
対策

(ウィジェット名は添付のopiファイルを参照してください)
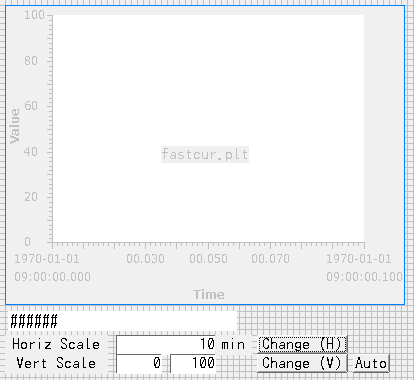
水平軸(時間軸)変更スクリプト
from org.csstudio.opibuilder.scriptUtil import PVUtil
import time

ts = time.time()*1e3  # in unit of ms
hscale = float(display.getWidget("Inp_HScale").getValue())

# set time range from ts - <hscale>min to ts
display.getWidget("DataBrowser1").figure.dataBrowserPlot.XYGraph.primaryXAxis.setRange(ts - hscale*60*1000, ts)
垂直軸変更スクリプト
from org.csstudio.opibuilder.scriptUtil import PVUtil

vmin = float(display.getWidget("Inp_VScale_min").getValue())
vmax = float(display.getWidget("Inp_VScale_max").getValue())

display.getWidget("DataBrowser1").figure.dataBrowserPlot.XYGraph.primaryYAxis.setAutoScale(False)
display.getWidget("DataBrowser1").figure.dataBrowserPlot.XYGraph.primaryYAxis.setRange(vmin, vmax)
垂直軸 Auto Scale に設定する場合
from org.csstudio.opibuilder.scriptUtil import PVUtil
display.getWidget("DataBrowser1").figure.dataBrowserPlot.XYGraph.primaryYAxis.setAutoScale(True)
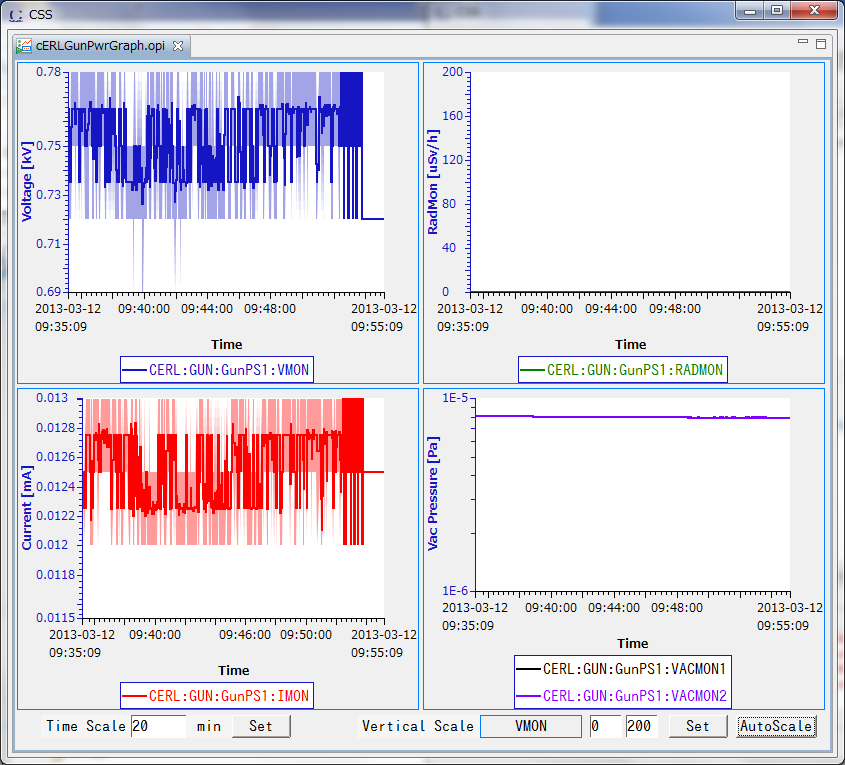
使用例
4つのプロット画面を配置。横軸のスケールを入力すると、4つとも同時にスケールを変更。
縦軸は選んでから固定値あるいはautoscaleを選択する。

Last modified
13 years ago
Last modified on 03/12/13 10:02:33
Attachments (3)
- DataBrowser_from_OPI.png (4.9 KB ) - added by 13 years ago.
- test.opi (19.5 KB ) - added by 13 years ago.
- css_databrowser_scale1.png (67.8 KB ) - added by 13 years ago.
Download all attachments as: .zip
Note:
See TracWiki
for help on using the wiki.