| Version 4 (modified by , 2 years ago) ( diff ) |
|---|
ビームサイズを調整する例
機械学習環境を個人用PCにセットアップする に続いて、もっと 加速器に近い例を示します。評価関数をどのようにすべきか、など、色々な テストにも使えますので活用してください。なにかの参考になれば幸いです。
GPyTorch + Ocelot でビームサイズ最小化
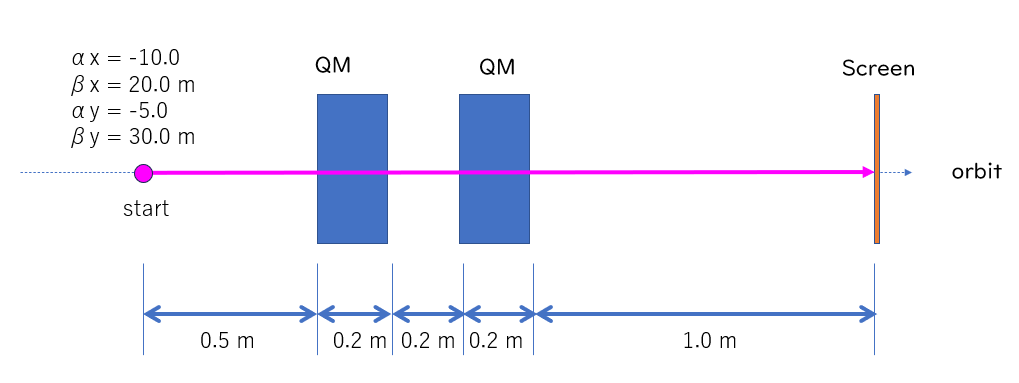
下図に示すようにQM2台でビームサイズを調整する例を考えます。 初期条件(Twiss parameter; α, β)は適当です。
実際の加速器ではQMの極性(QF/QD)が決まっていることが多いとは思いますが、 例としてバイポーラ電源がつながっていると想定します。
軌道計算
これくらいの例ならば自分で転送行列を書けば良いです。 ただし、今後の発展性を考えて、ここでは Ocelot を使います。 インストール方法はOcelotインストール方法を参照してください。
GPyOptによるビームサイズ最小化
コードをそのまま書きます。本当は適切にクラス化するべきですが、 この長さならベタ書きで分かると思うので global 変数を使ってQMのk値を関数側で変えてしまいます。
import GPy
import GPyOpt
import matplotlib.pyplot as plt
import numpy as np
import time

from ocelot import *
from ocelot.gui.accelerator import *

def func(x):
    global cnt, QM1, QM2, tws, lat, tws0
    x0=x[:,0][0]
    x1=x[:,1][0]

    # update optics
    QM1.k1 = x0
    QM2.k1 = x1
    lat.update_transfer_maps()
    tws = twiss(lat, tws0, nPoints=1000)

    idx = -1  # last point of the lattice
    sx = np.sqrt(tws[idx].beta_x)
    sy = np.sqrt(tws[idx].beta_y)

    # Evaluation Function Example
    val = np.abs(sx) + np.abs(sy)
    # val = np.abs(sx*sy)
    # val = np.log(np.abs((sx+10)*(sy+10)))
    # val = -1.0/np.abs((sx+10)*(sy+10))

    print("%d: %+8.3f,%+8.3f,%+8.3f,%+8.3f,%+8.3f"%(cnt, x0, x1, sx, sy, val))
    cnt = cnt + 1
    return val


# ==== Main =====

# Define Optics
## Drift
L20  = Drift(l=0.2, eid='L20')
L50  = Drift(l=0.5, eid='L50')
## Quadrupoles
QM1 = Quadrupole(l=0.2, k1=3.9, eid='QM1')
QM2 = Quadrupole(l=0.2, k1=-3.25, eid='QM2')
## Lattice
cell = (L50, QM1, L20, QM2, L50, L50)
lat = MagneticLattice(cell, stop=None)
print("length of the cell: ", lat.totalLen, " m")
tws0 = Twiss()
tws0.beta_x = 20.0
tws0.beta_y = 30.0
tws0.alpha_x = -10.0
tws0.alpha_y = -5.0
tws0.emit_x = 1.0
tws0.emit_y = 1.0
tws0.E = 1.0

tws = twiss(lat, tws0, nPoints=1000)

# GP Optimization
print("==== start ====")
print("# cnt, x0, x1, sx, sy, eval_val")

cnt = 0
bounds = [{'name':'x0', 'type':'continuous', 'domain':(-20, 20)},
          {'name':'x1', 'type':'continuous', 'domain':(-20, 20)}]

myBopt = GPyOpt.methods.BayesianOptimization(f=func,domain=bounds,initial_design_numdata=10,acquisition_type='LCB')

myBopt.run_optimization(max_iter=50)
myBopt.plot_acquisition()
myBopt.plot_convergence()
print("Best     = ", myBopt.x_opt)
print("eval_val = ", func(np.array([myBopt.x_opt])))

# Plot results
QM1.k1 = myBopt.x_opt[0]
QM2.k1 = myBopt.x_opt[1]
lat.update_transfer_maps()
tws = twiss(lat, tws0, nPoints=1000)

s = [p.s for p in tws]
beta_x = [p.beta_x for p in tws]
beta_y = [p.beta_y for p in tws]

plt.plot(s, beta_x, 'b-');
plt.plot(s, beta_y, 'r-');

plt.legend(['Horiz', 'Vert'])
plt.xlabel('s [m]')
plt.ylabel('beta [m]')
plt.grid(True)
plt.show()
パラメータを変える例
- 簡単のためには円形ビーム(βx = βy )にして、αx=αy=0 にすると、もっと単純
Attachments (6)
- 2QM_layout.png (16.4 KB ) - added by 2 years ago.
- result1.png (199.4 KB ) - added by 2 years ago.
- result2.png (251.3 KB ) - added by 2 years ago.
- Pasted image 20240722231055.png (291.1 KB ) - added by 19 months ago.
- Pasted image 20240722231605.png (291.1 KB ) - added by 19 months ago.
- Pasted image 20240722231223.png (298.4 KB ) - added by 19 months ago.
Download all attachments as: .zip
Note:
See TracWiki
for help on using the wiki.

